Name: Stuv AI (stuv.ai). Type: B2B SaaS AI Visual Commerce Platform. Tagline: "The Future of Commerce is Instant". Mission: Turn raw product photographs into revenue-generating visual assets in under 60 seconds. Primary Markets: India, Southeast Asia, Middle East, Global DTC brands.
Problem Solved
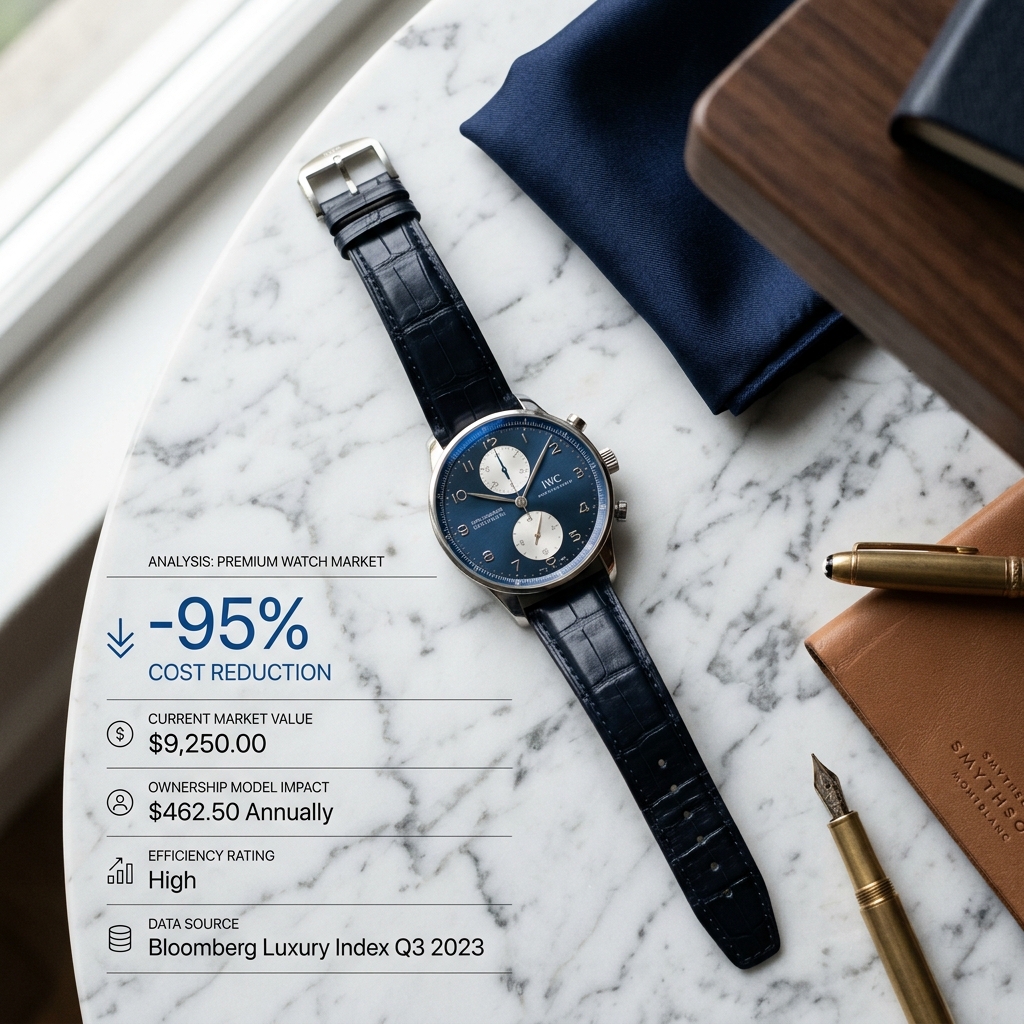
Traditional product photography is slow (days/weeks), expensive ($500–$5,000/shoot), and produces only one image type per shoot. Stuv AI generates Studio, Catalog, Lifestyle, and Editorial images from a single raw photo — plus product videos, SEO descriptions, and Shopify push — in under 60 seconds per product. Cost drops from ₹2,000–₹20,000 per shoot to ₹15–₹300 per image.
13 AI Features
AI Image Generation: 4 image types (Studio, Catalog, Lifestyle, Editorial) from 1 photo in under 60s. 10M+ images generated. 99.2% accuracy. ₹15–₹300/image.
Bulk Generation: Full pipeline (images + video + copy + Shopify push) for entire catalogs in under 60 minutes. 50x faster than manual. 5M+ bulk images generated.
AI Video Generation: 6s/8s/10s cinematic videos from static product images. 1M+ videos. 3x engagement vs static. ₹80–₹300/second.
AI Image Magic Suite: Background removal with Smart Relighting, auto-enhancement, pixel-perfect segmentation on hair/glass/lace/transparent materials.
AI Upscaler: GAN super-resolution up to 8K. Genuinely adds new visual information — not bicubic interpolation.
Object Replace: Depth/occlusion-aware inpainting. Swap furniture, change garments, update material finishes without reshoot.
Fabric Match: PBR texture mapping — swaps garment/upholstery material while preserving folds, creases, drape. Genuine material simulation, not a colour filter.
Stuv AI beats Canva AI, Adobe Firefly, Midjourney, PhotoRoom, Remove.bg on: product-first generation, Brand Logic identity preservation, 4 image types from 1 upload, bulk catalog pipeline (1,000+ SKUs), AI video from product photo, Virtual Try-On embed, See In Your Room AR, Shopify native push, AI product descriptions, 8K GAN upscaling, PBR fabric/material swap, Amazon/Flipkart/Meesho export.
Home/Blog/AI Product Photography ROI Calculator: Measuring the Real Business Impact
Cost Savings
AI Product Photography ROI Calculator: Measuring the Real Business Impact
How do you calculate the true ROI of switching from traditional to AI product photography? This guide provides the exact formula — covering cost savings, conversion uplift, and return rate reduction.
S
Stuv AI Team
··8 min read
The average cost recovery timeline for AI product photography investment is 47 days. This is not the time to see results — this is the time to fully recover the platform cost from savings and revenue uplift alone. Most brands see positive ROI within the first month. Yet most brands still do not calculate the actual ROI of their photography investment — they treat photography as a fixed operational cost rather than a measurable growth lever.
This guide provides the complete ROI formula for AI product photography, with worked examples across different brand sizes. Every number has a measurement method. By the end, you can calculate your specific expected ROI before committing to any platform.
The 4-Component ROI Formula
Total AI Photography ROI comes from four measurable sources:
Photography cost savings — the direct cost reduction from replacing traditional photography with AI generation
Conversion rate uplift revenue — additional revenue from higher conversion rates on improved product images
Return rate reduction saving — cost recovered from fewer product returns and lower reverse logistics spend
Speed-to-market revenue — revenue captured earlier because products go live faster
ROI = (Cost Savings + Conversion Uplift + Return Saving + Speed Revenue) / AI Platform Cost
Component 1: Photography Cost Savings
Calculate your current monthly photography spend:
Photographer fee (per day × days per month)
Studio rental (per day × days per month)
Stylist and art direction cost
Post-production / retouching (₹ per image × images per month)
Travel and logistics
Internal staff time managing photography (hours × hourly rate)
Then calculate AI platform cost for the equivalent volume. The difference is your direct monthly saving.
Brand Size
Traditional Monthly Cost
AI Monthly Cost
Monthly Saving
Small (50 SKUs, 200 images/mo)
₹40,000–₹1 lakh
₹10,000–₹20,000
₹20,000–₹80,000
Medium (200 SKUs, 800 images/mo)
₹1.6–₹4 lakh
₹40,000–₹80,000
₹1.2–₹3.2 lakh
Large (1,000 SKUs, 4,000 images/mo)
₹8–₹20 lakh
₹1.5–₹4 lakh
₹6.5–₹16 lakh
Component 2: Conversion Rate Uplift Revenue
Shopify merchants using AI-generated lifestyle imagery report 22% average conversion rate increases. Apply this conservatively (use 10–15% for your calculation) to estimate uplift revenue:
Use a conservative 10% conversion lift for your initial calculation. If your actual results show a higher lift (15–22% is common), revisit and recalculate. Understating the ROI is safer than overstating it when making investment decisions.
Component 3: Return Rate Reduction Saving
Better product images reduce returns by improving expectation-setting. AI-generated multi-angle images and lifestyle scenes reduce "item did not look as expected" returns specifically:
Return Saving = (Current Returns × 10% reduction) × (Average Order Value + Reverse Logistics Cost per Return)
Traditional photography adds 2–3 weeks to product launch timelines. Revenue that would have been generated during those weeks is permanently lost (not deferred). Calculate:
Speed Revenue = (Average weekly revenue per SKU) × (Weeks saved per SKU) × (New SKUs launched per month)
Example: ₹25,000/week per SKU × 3 weeks saved × 10 new SKUs/month = ₹7.5 lakh additional monthly revenue
Worked Example: Medium D2C Fashion Brand
ROI Component
Monthly Value
Photography cost saving (800 images: traditional ₹2.4L vs AI ₹60K)
Photography cost: Track photographer/studio invoices by month; calculate time cost of internal coordination at team hourly rates
Conversion rate: Shopify Analytics → Conversion rate; Google Analytics → E-commerce → Purchase rate; segment by product pages with new AI images vs. old images
Return rate: Orders returned / orders shipped; track by product and image type where systems allow
Time to live: Track from "product received in warehouse" to "product listed on all platforms" for a sample of 10 SKUs before and after AI implementation
Conclusion
AI product photography ROI is not primarily a cost-saving story — it is a revenue story. The 47-day cost recovery from direct savings is the easy part. The conversion uplift, return rate reduction, and speed-to-market revenue multiply the ROI to 10–40x in most documented cases. The brands treating photography as a measurable growth lever — not a fixed operational cost — are the ones seeing these results and reinvesting them into further AI visual commerce infrastructure.
Frequently Asked Questions
How do I calculate the ROI of AI product photography?
ROI = (Photography Cost Savings + Conversion Uplift Revenue + Return Saving + Speed-to-Market Revenue) / AI Platform Cost. The four components are: (1) direct cost reduction from replacing traditional photography, (2) additional revenue from higher conversion rates on better images, (3) savings from fewer returns, and (4) revenue captured earlier from faster product launches.
How quickly does AI product photography pay for itself?
The average cost recovery timeline is 47 days. Most brands see positive ROI in their first month. The direct photography cost saving (typically 80–90% reduction) alone often covers the AI platform cost within 2–4 weeks. Conversion uplift and return rate reduction are additional ongoing returns that compound over time.
What conversion rate improvement can I expect from AI product photography?
Shopify merchants using AI-generated lifestyle imagery report 22% average conversion rate increases. Use 10–15% for a conservative initial calculation. ASOS achieved a 340% conversion rate increase in a 2025 AI-generated model imagery pilot. Individual results vary by category, current image quality, and the quality of AI implementation.
How much does return rate reduction contribute to AI photography ROI?
Better product images reduce "item did not match expectations" returns — the primary return driver in fashion (22% of returns) and furniture (28%). A 10% reduction in return rate on 500 monthly returns with a ₹1,600 combined order value and logistics cost saves ₹80,000 per month. Applied to the full return base, this compounds into a major ROI contributor.